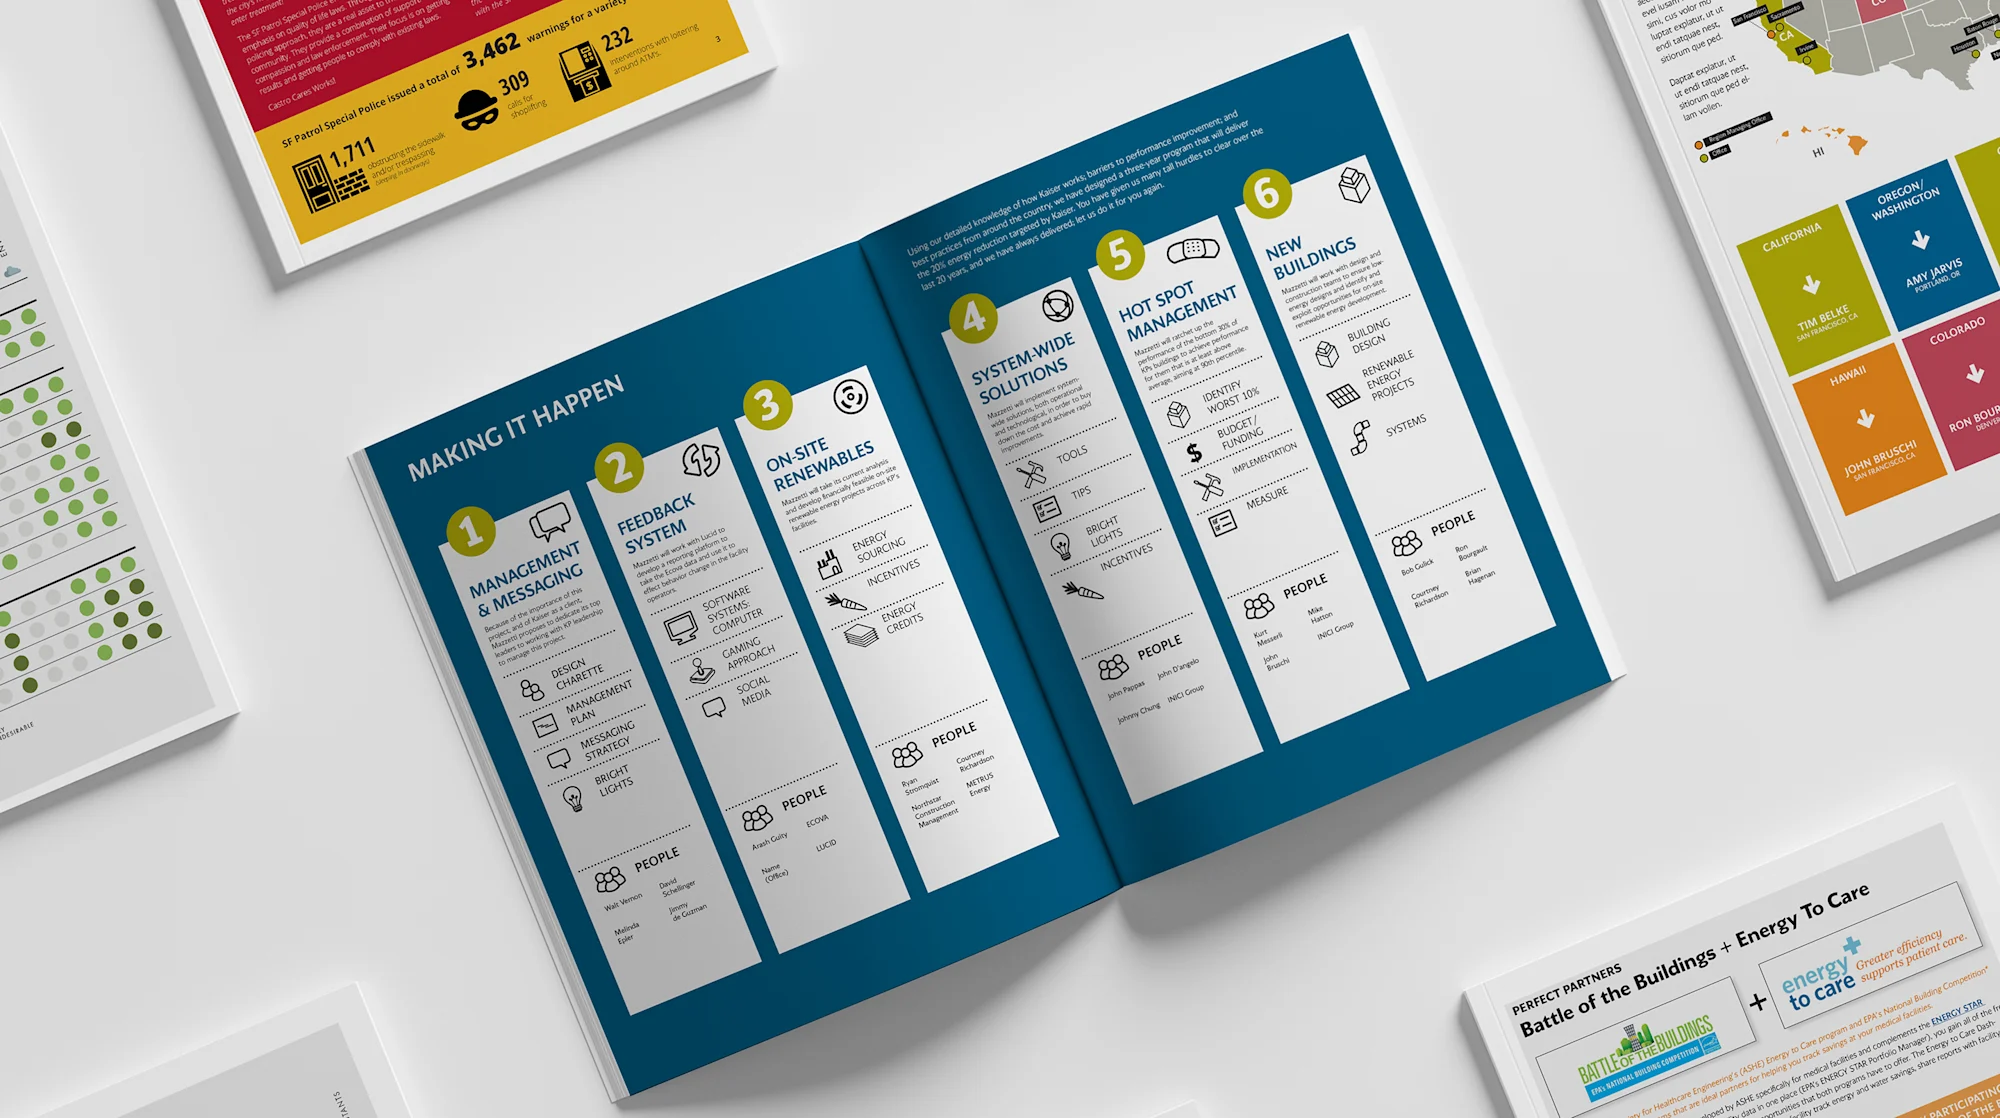
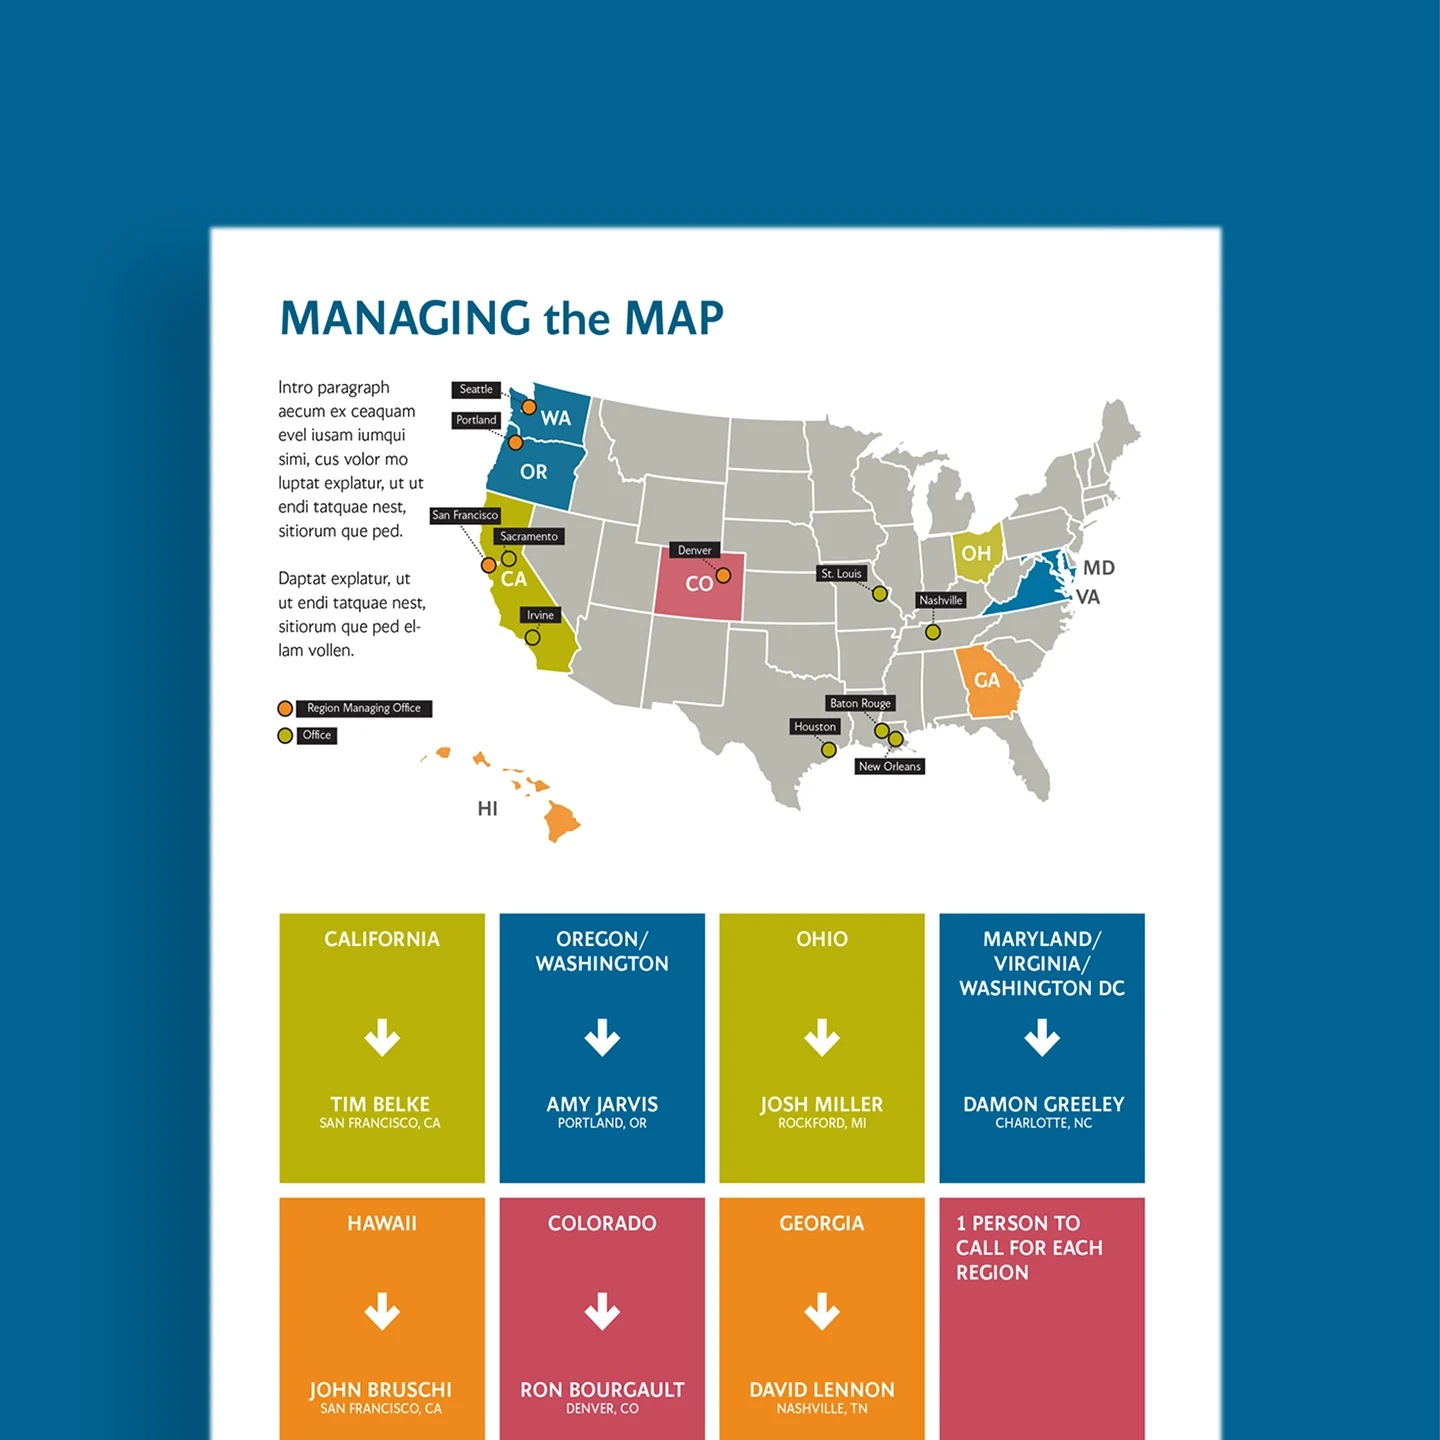
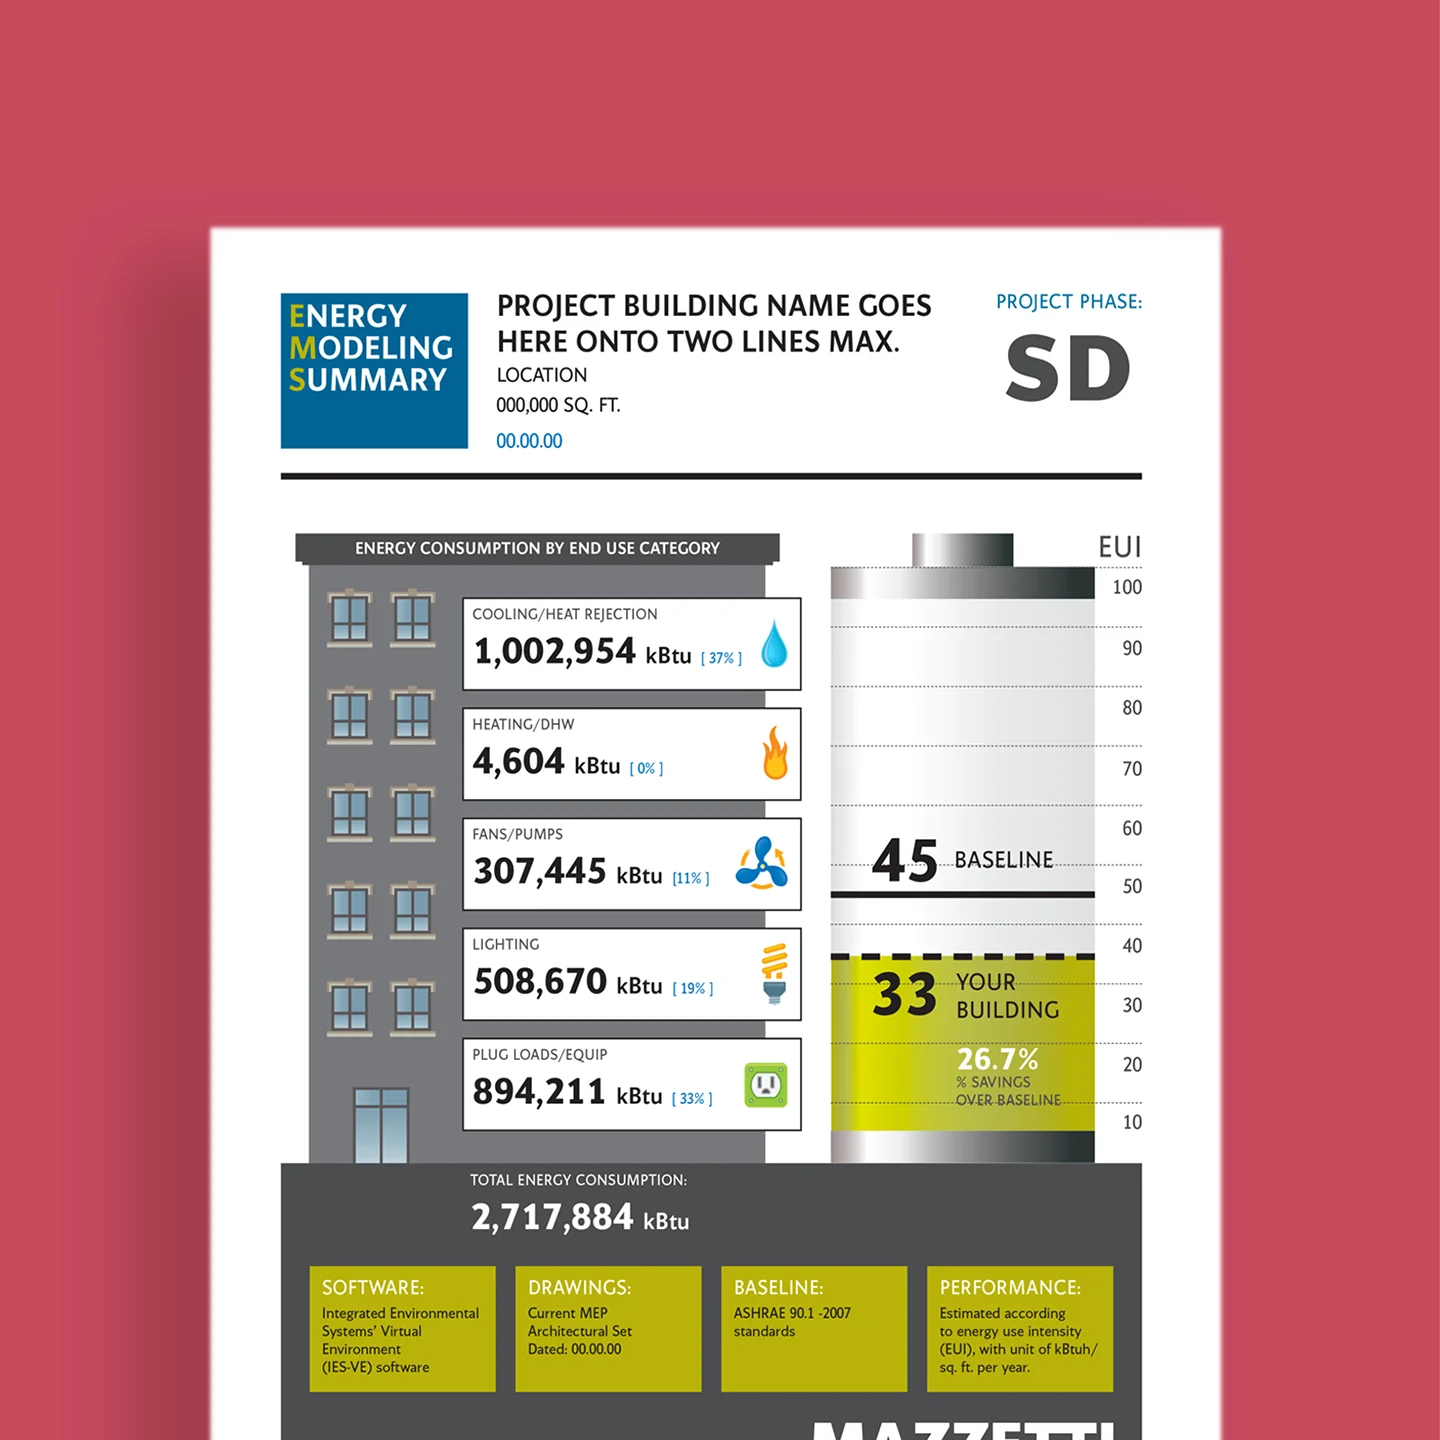
lcp has developed multiple diagrams and infographics for this San Francisco based MEP Engineering Company, documenting various types of sustainable energy sources and building operations.
Mazzetti
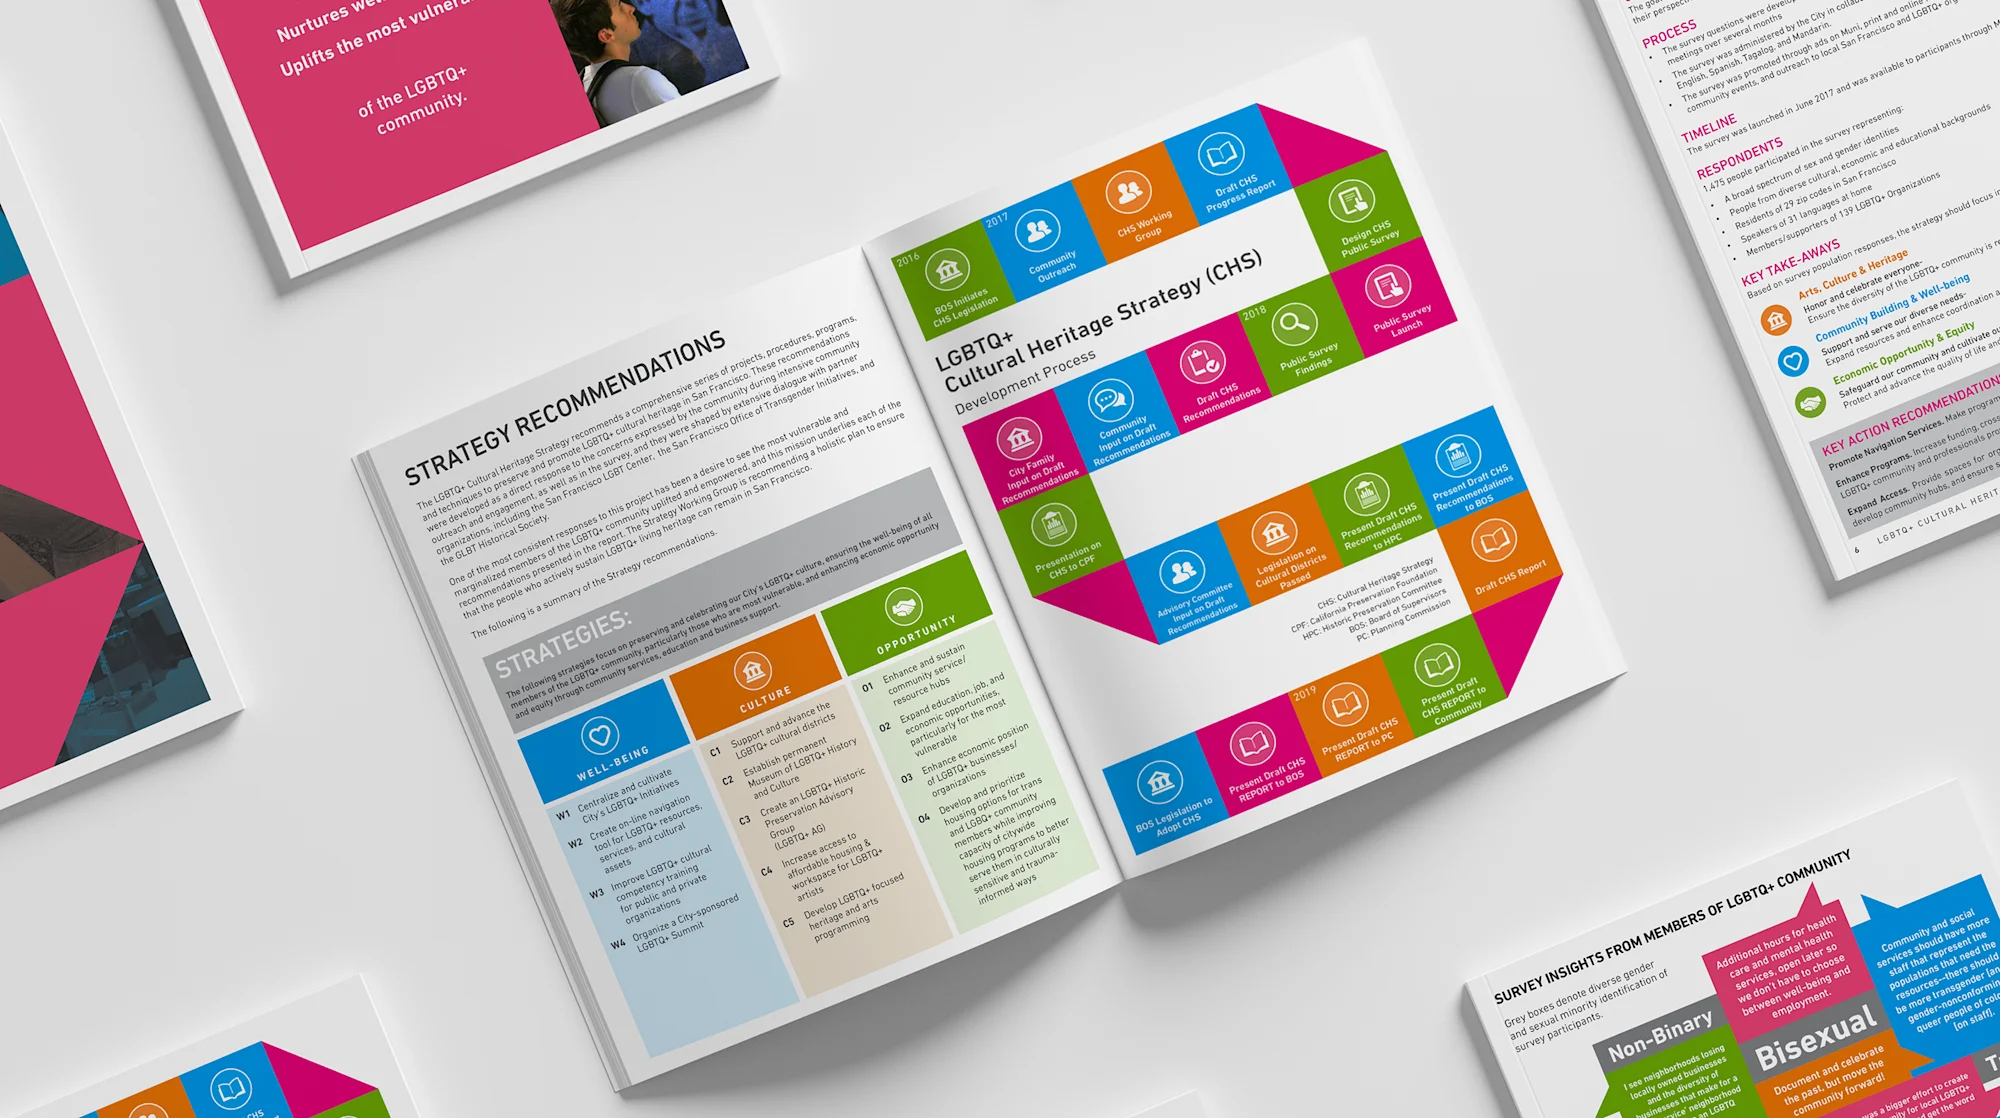
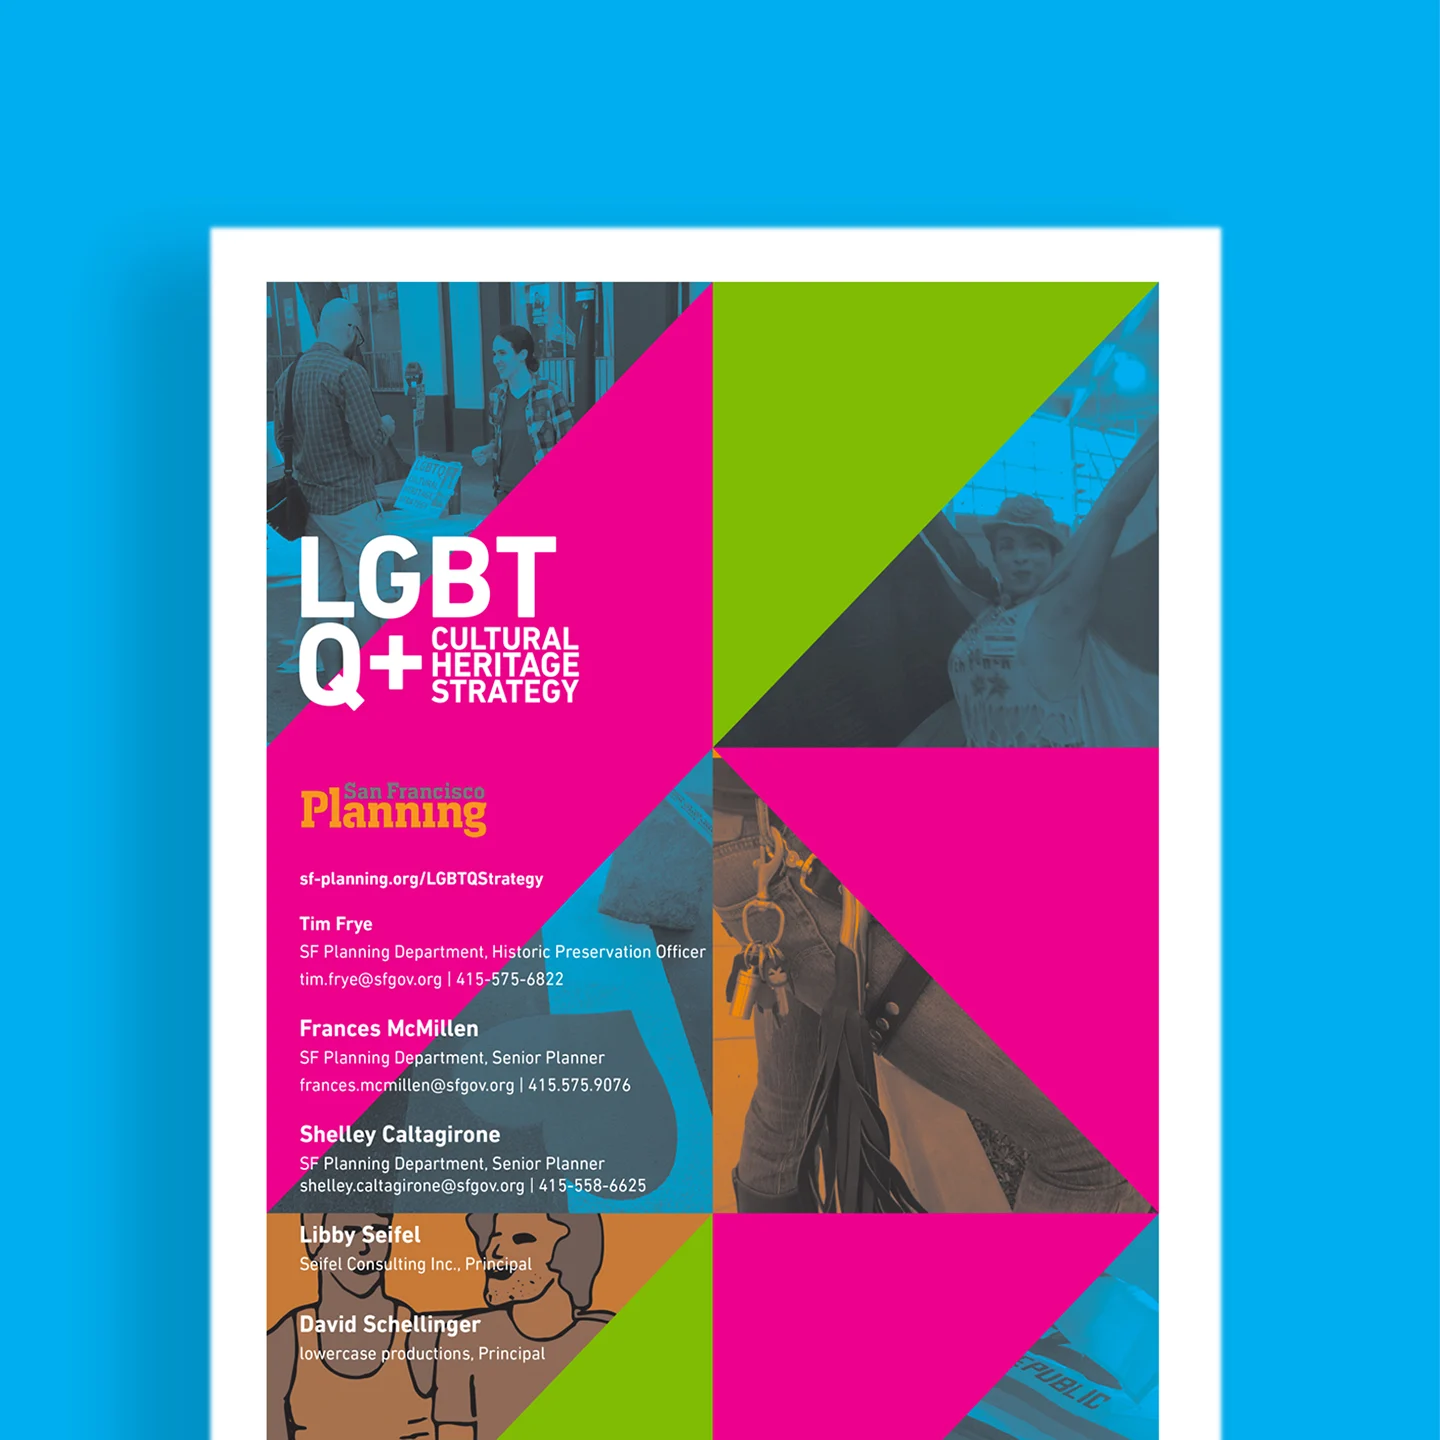
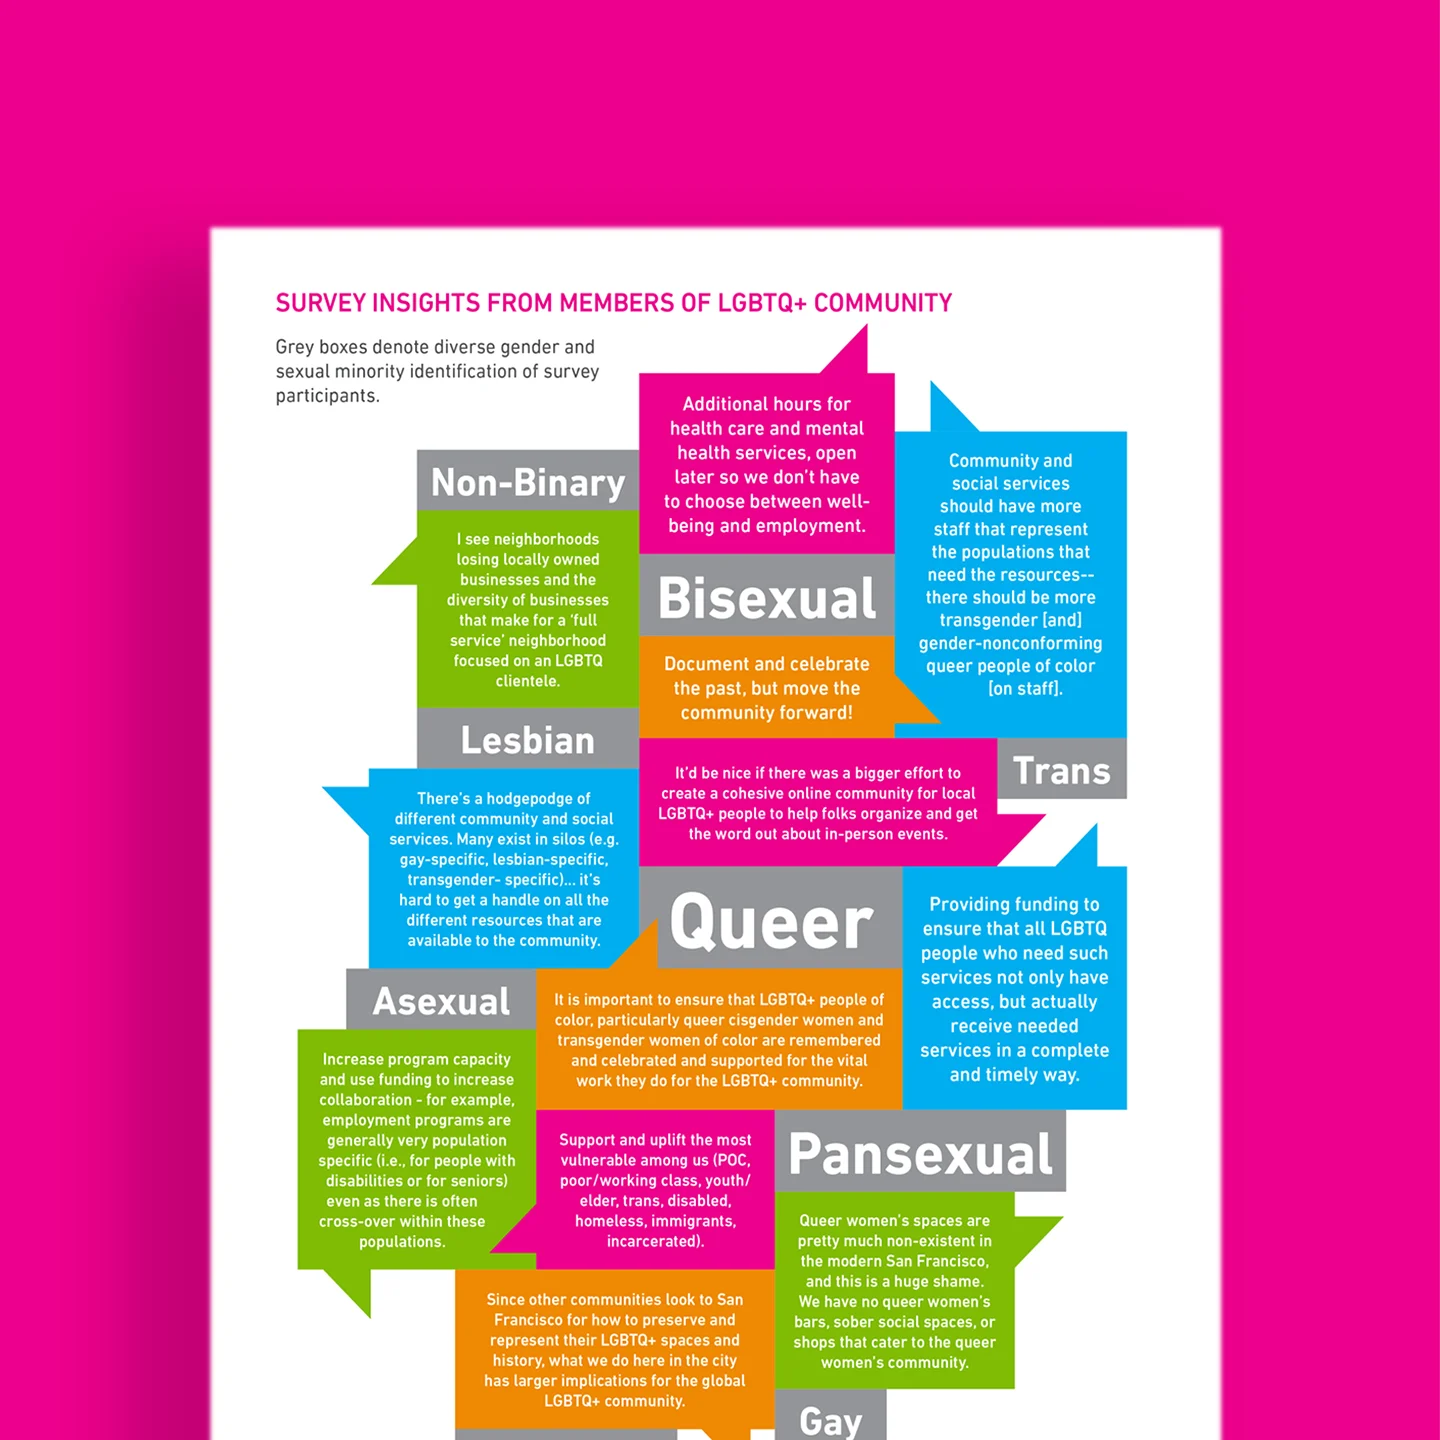
lcp designed a brand and suite of infographics and reports for San Francisco’s LGBTQ+ Cultural Heritage Strategy to help support culturally significant LGBTQ buildings, physical spaces and organizations that are integral to the history of both queer and straight culture in San Francisco.
LGBTQ+ Cultural Heritage Strategy
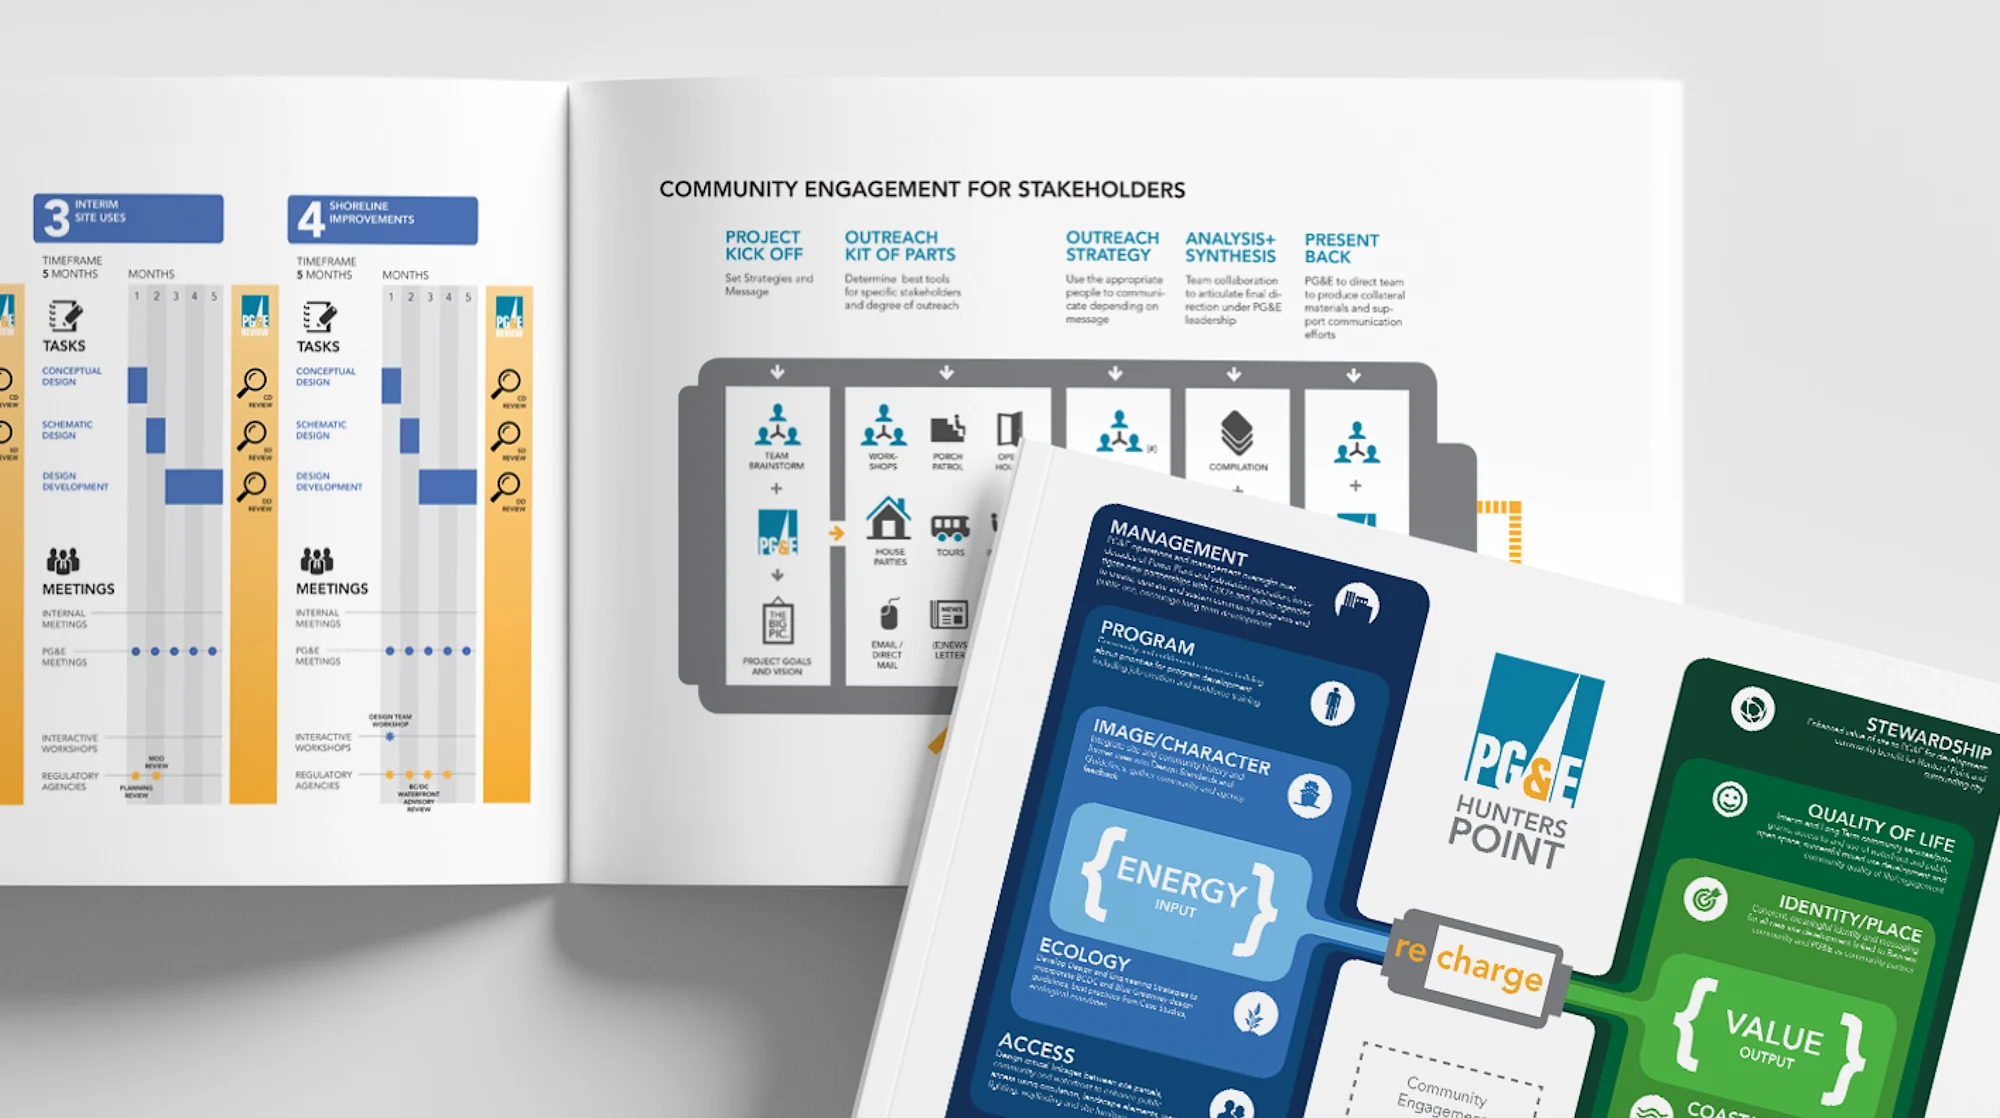
This infographic suite tells the story about a proposed renovation and re-envisioning for a formal Pacific Gas & Electric Power Plant in an economically disadvantaged neighborhood in San Francisco.
PG&E
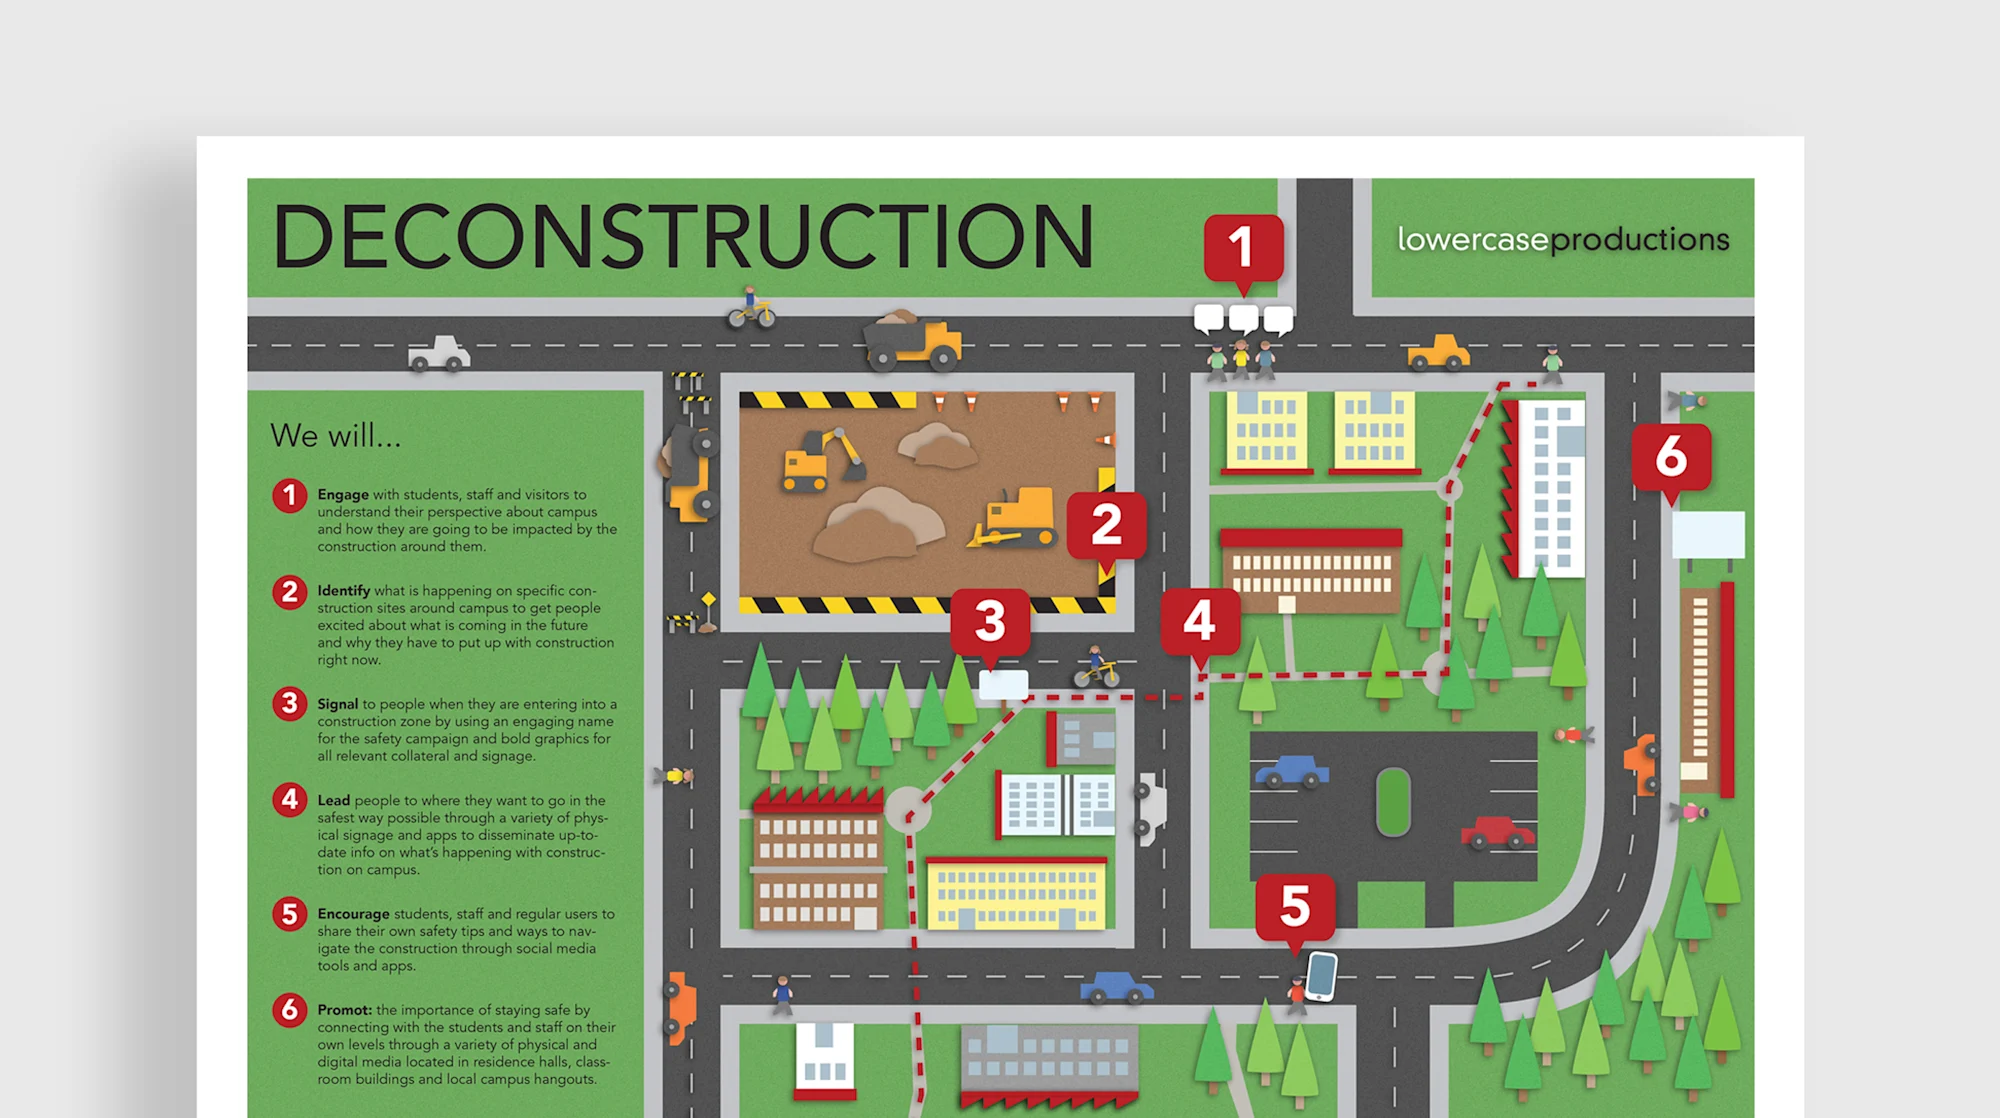
lcp was hired to help rethink how to share information about upcoming construction on campus, and how students, staff and visitors alike can be prepared and stay positive during a very challenging period.
Stanford University
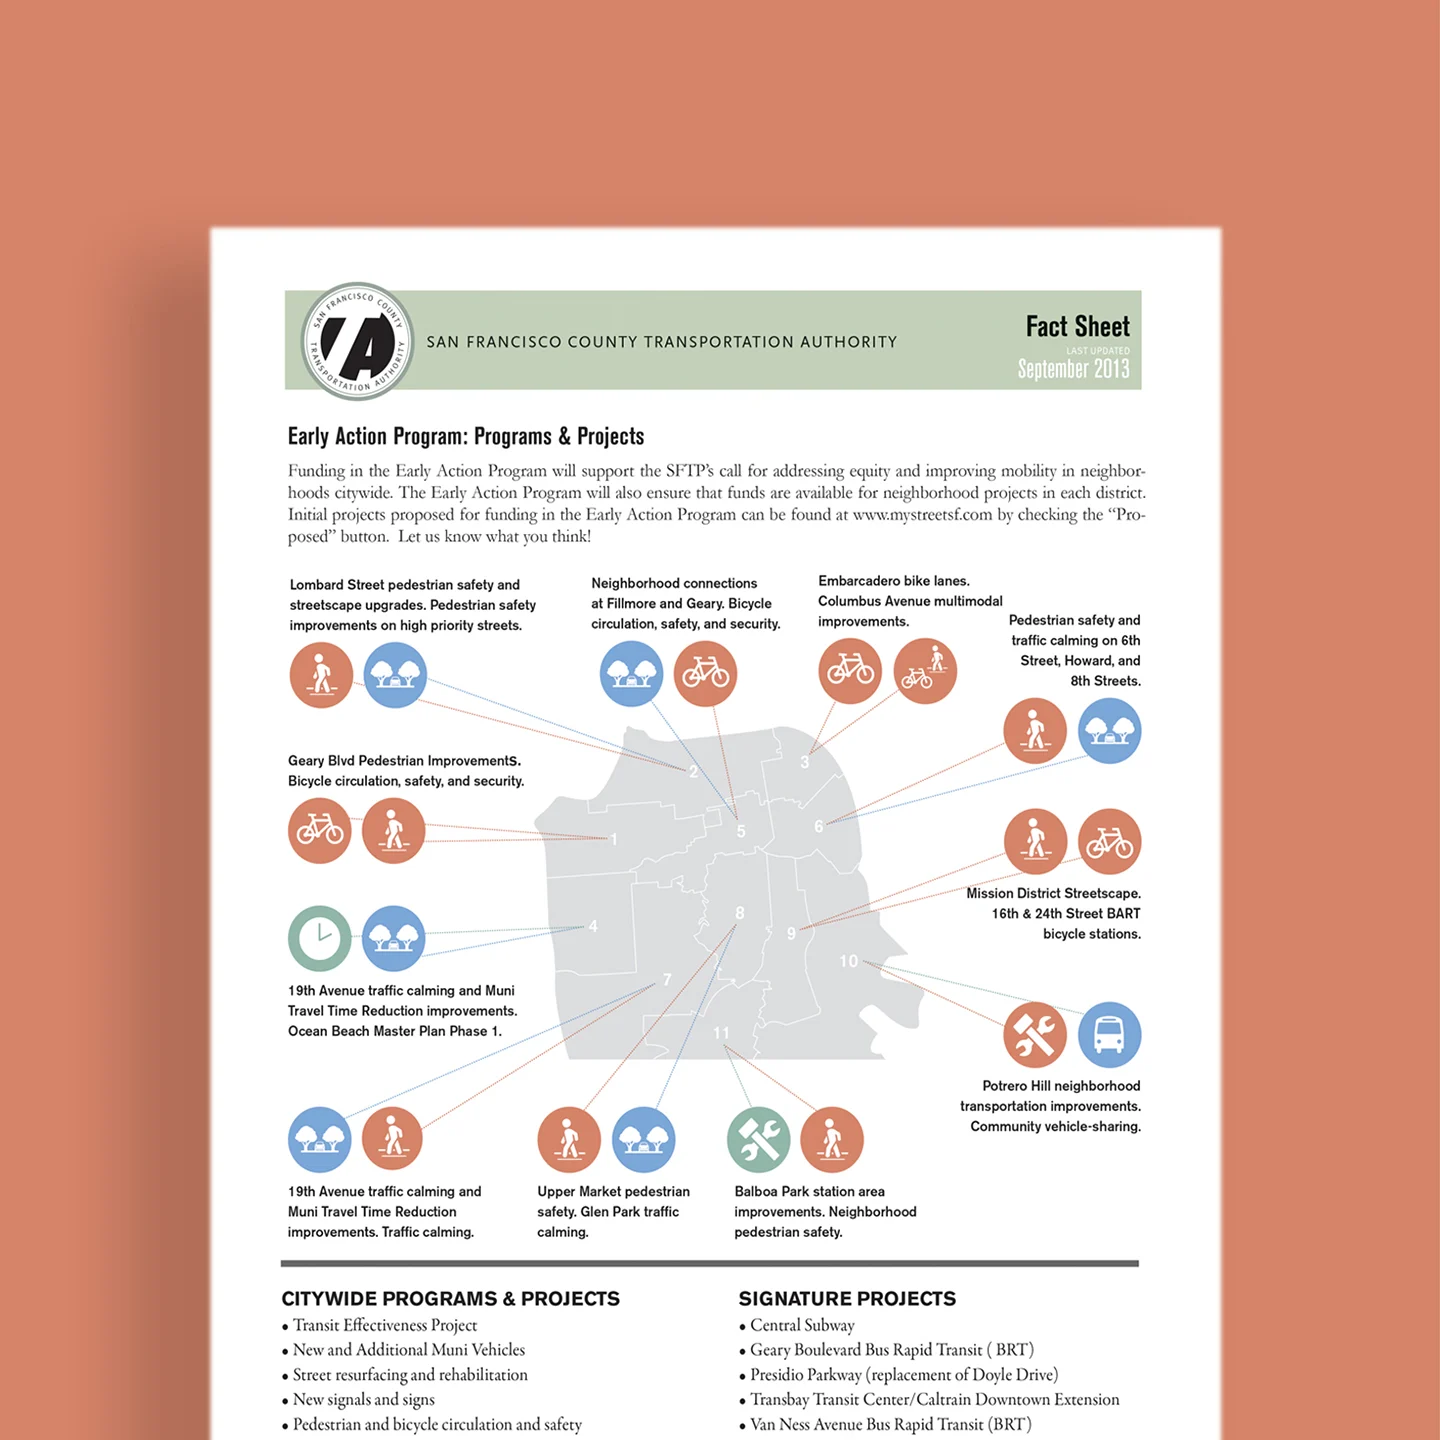
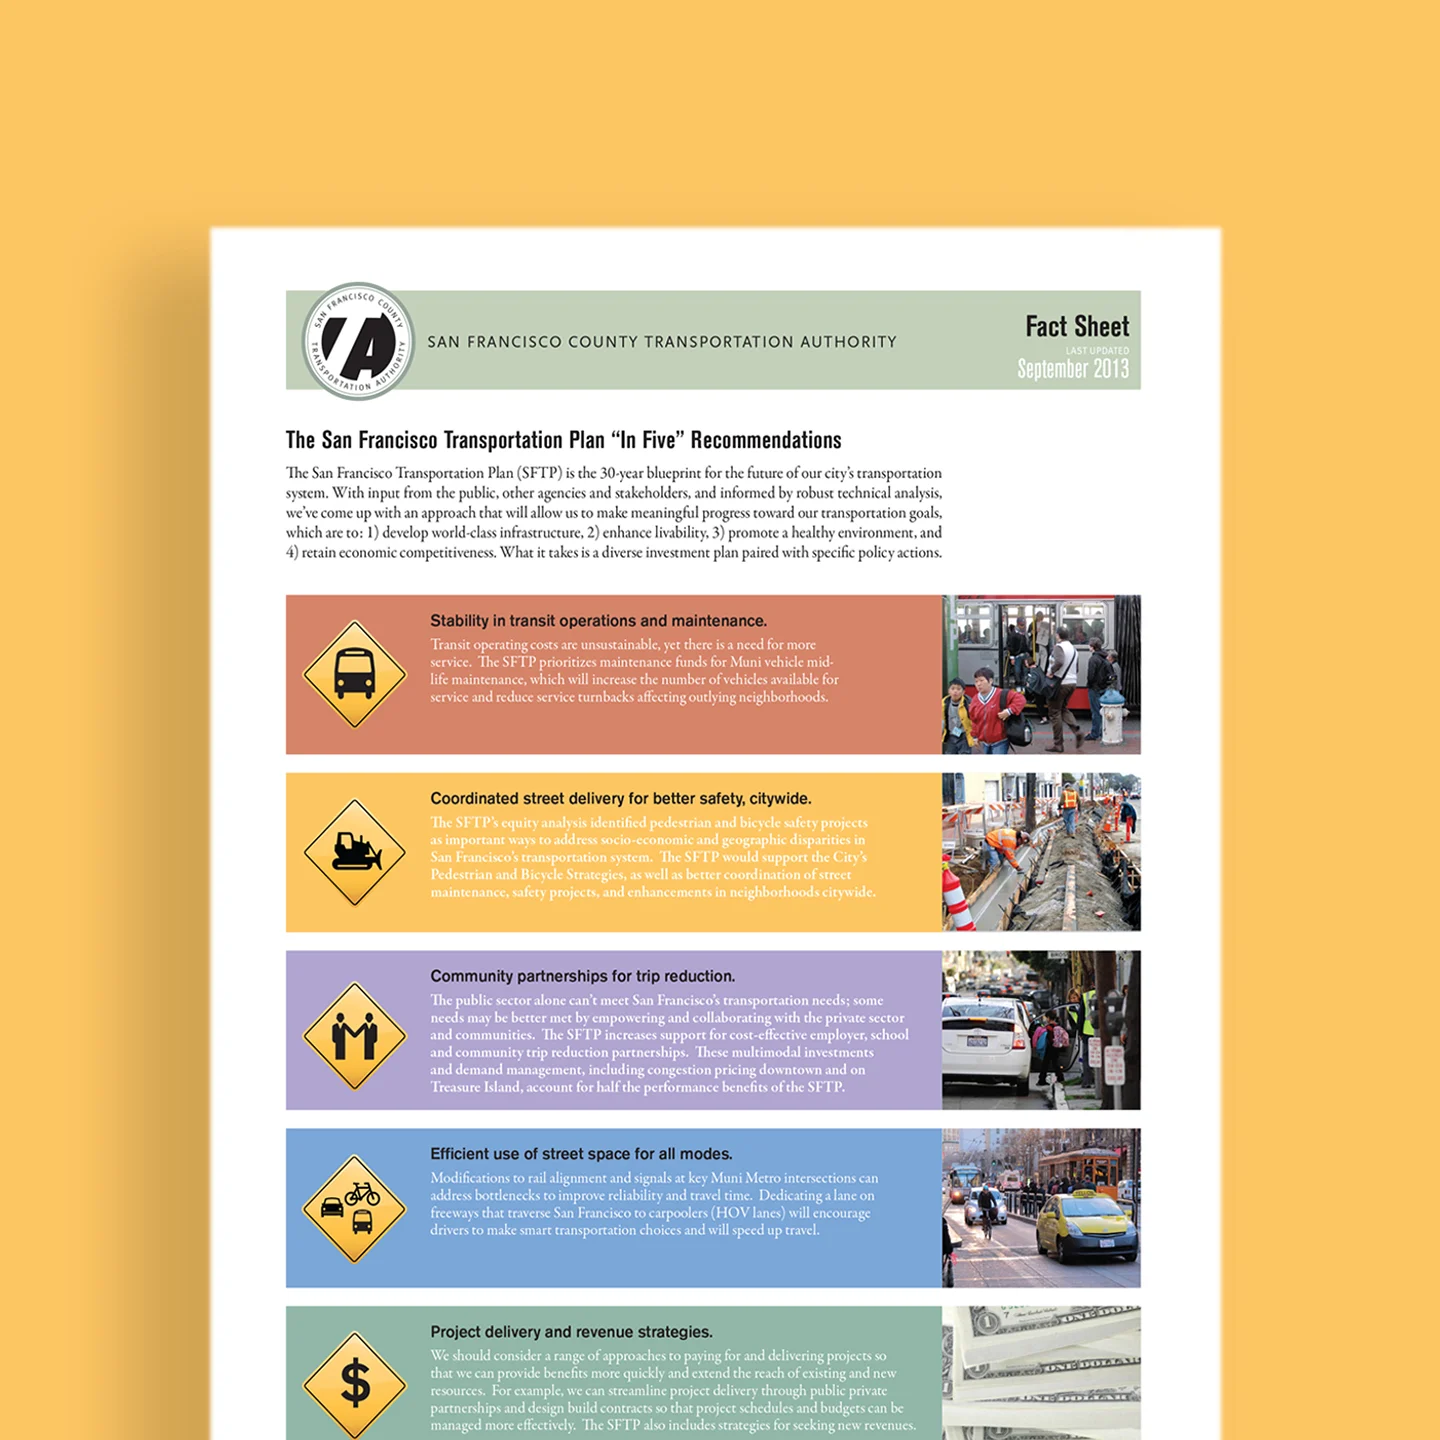
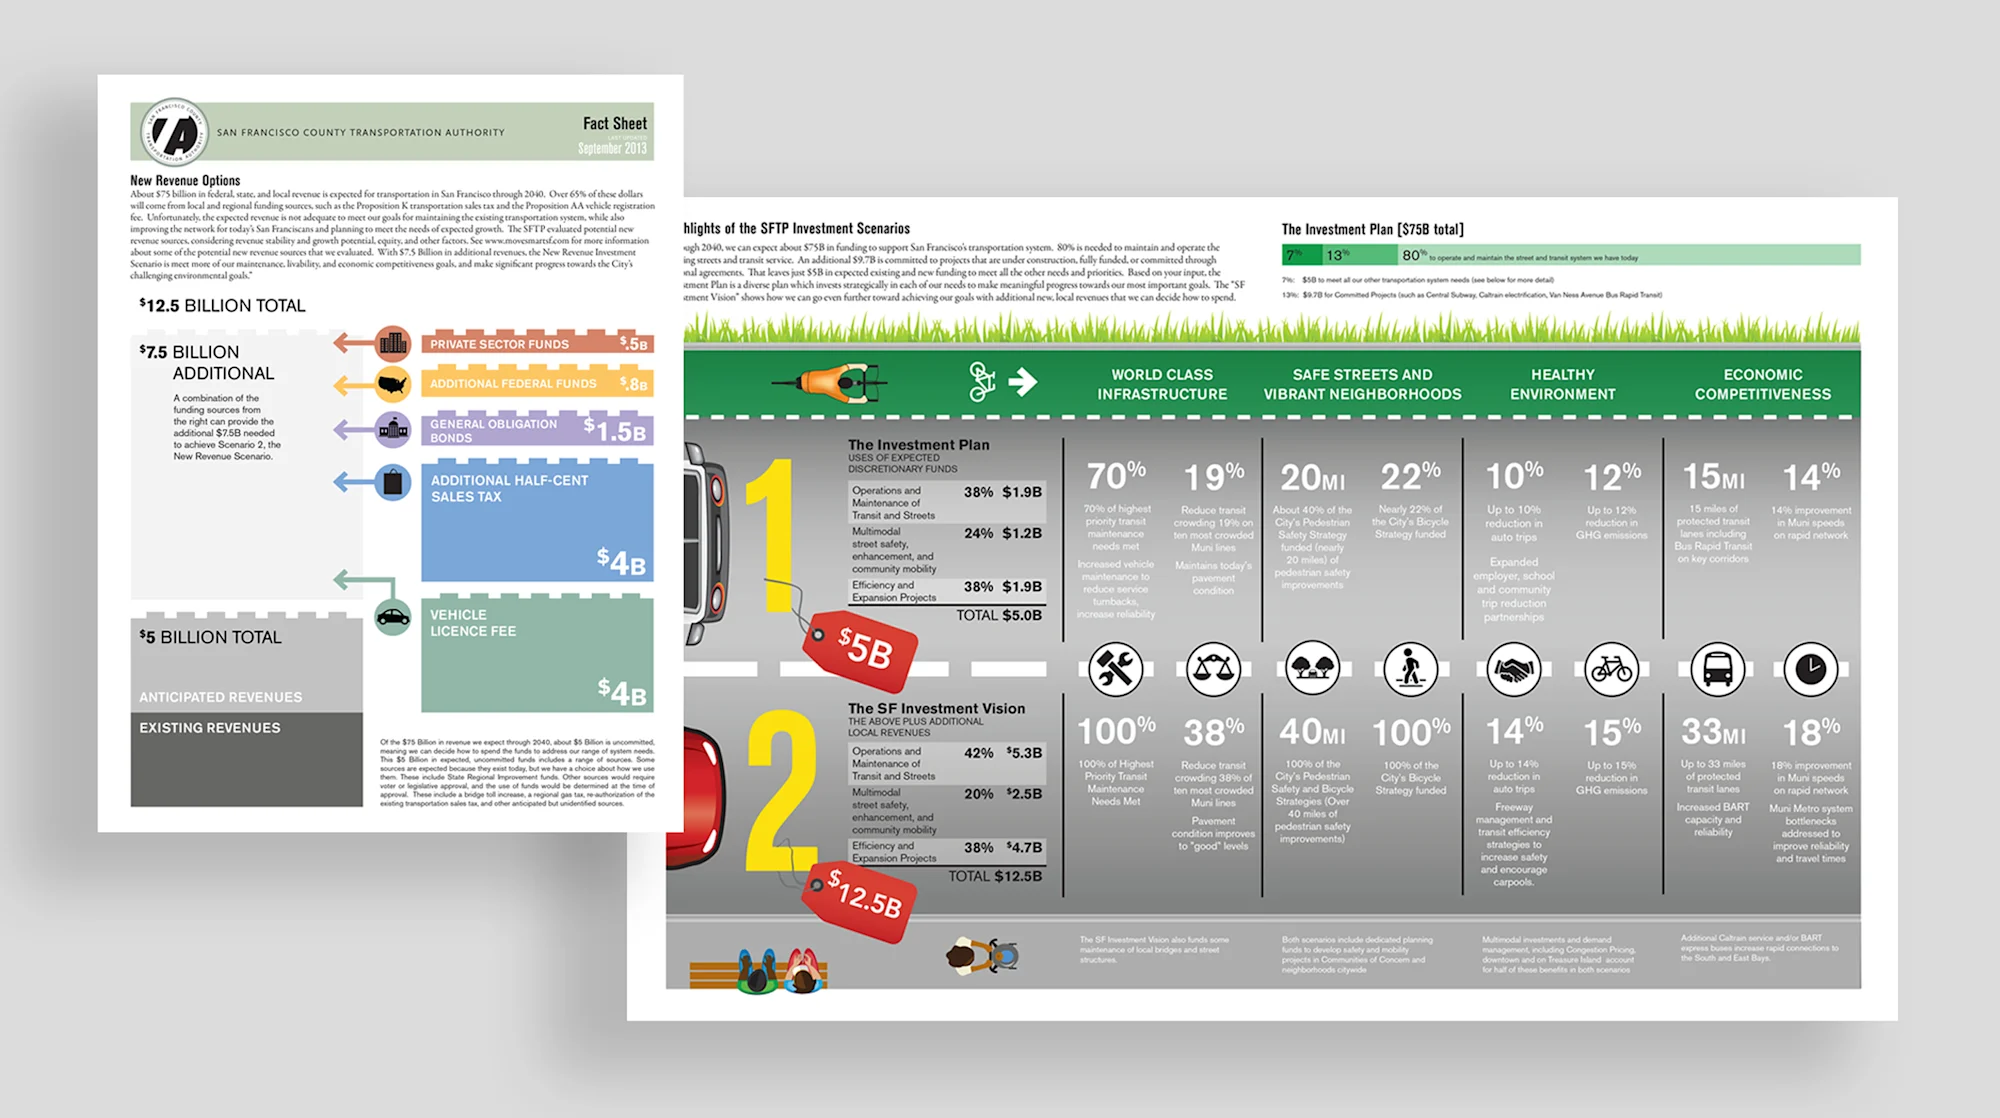
lcp developed a series of infographics for the San Francisco Transportation Plan, highlighting the project’s goals, potential revenue sources, sample projects, and comparing options for transit and transportation improvements.
San Francisco County Transportation Authority
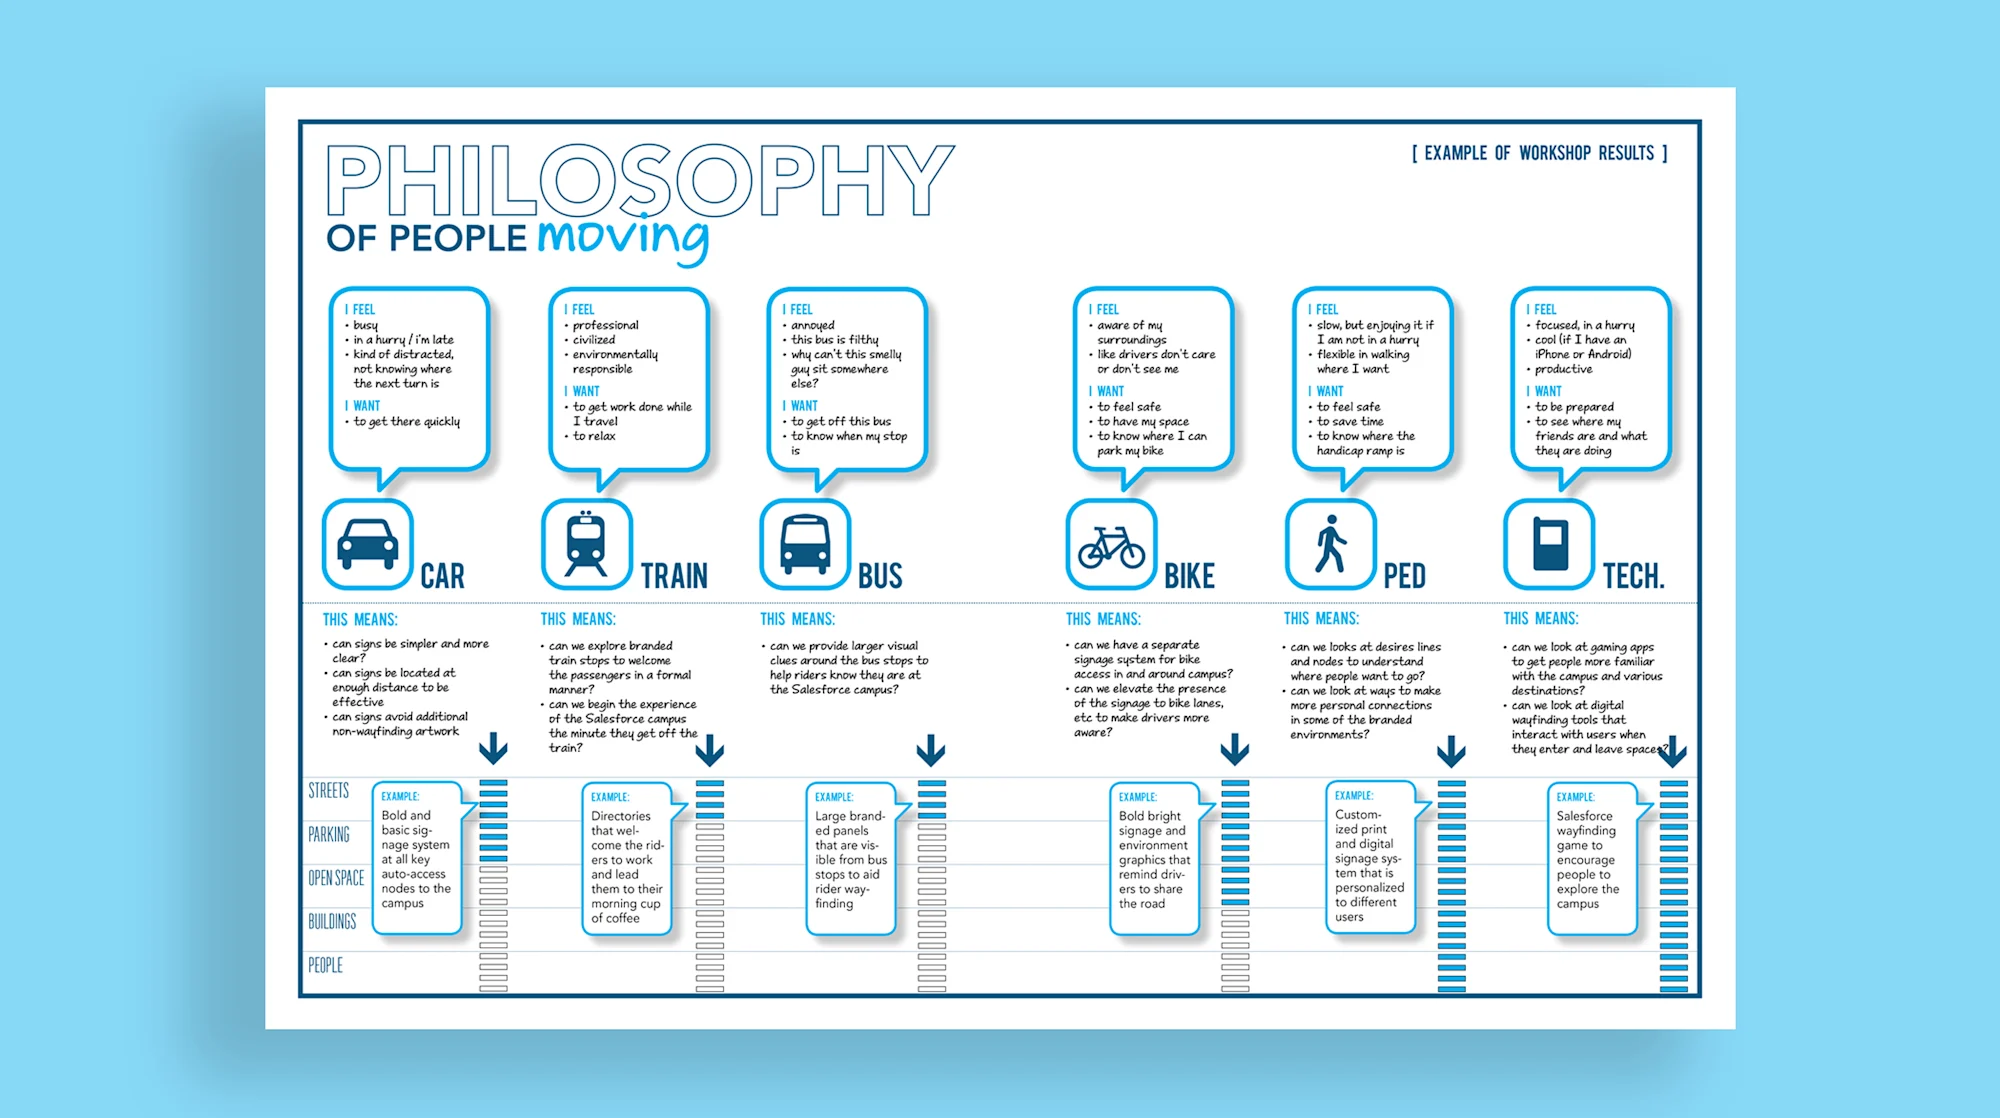
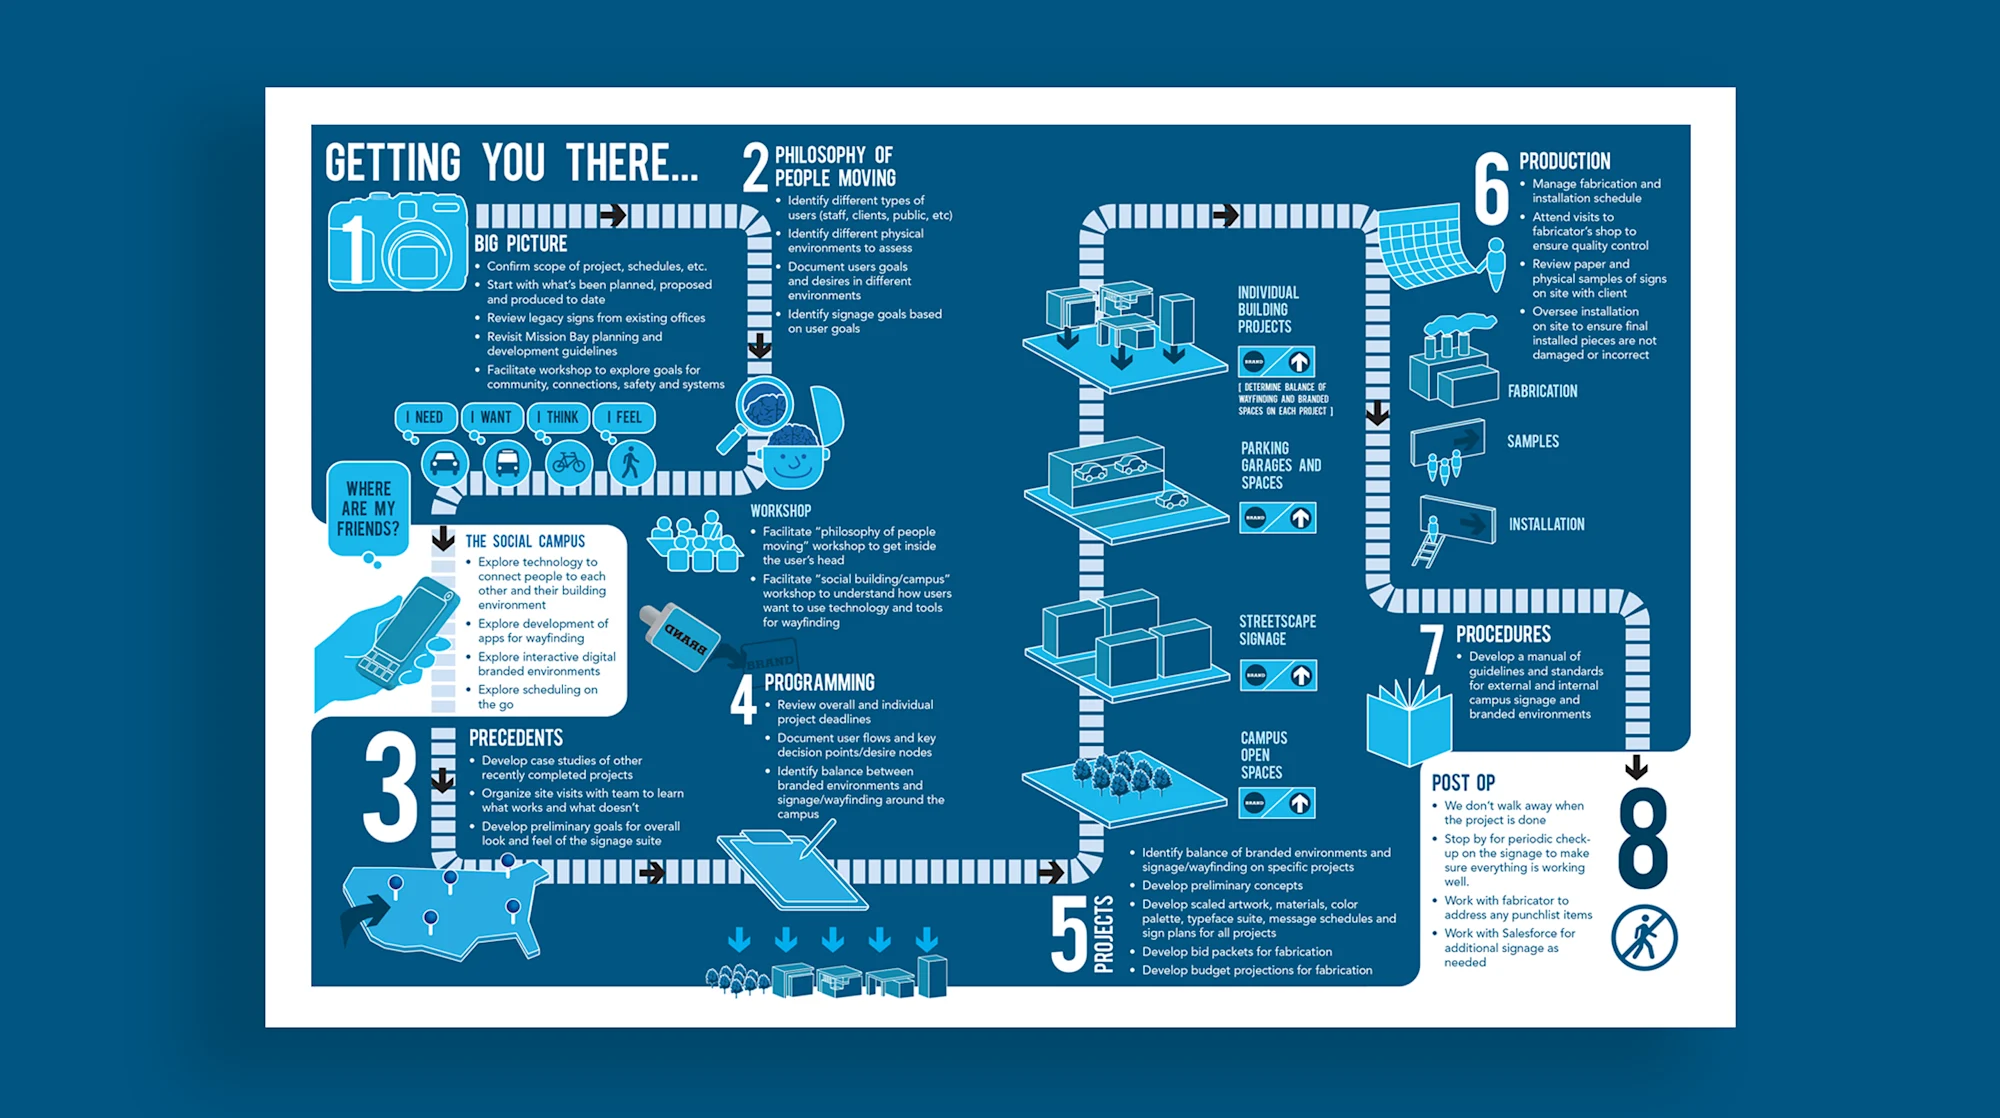
lcp developed several infographics explaining our wayfinding and signage process, which is focused on understanding people’s mind-sets, interests, desires, and destinations.
lcp's Signage Process
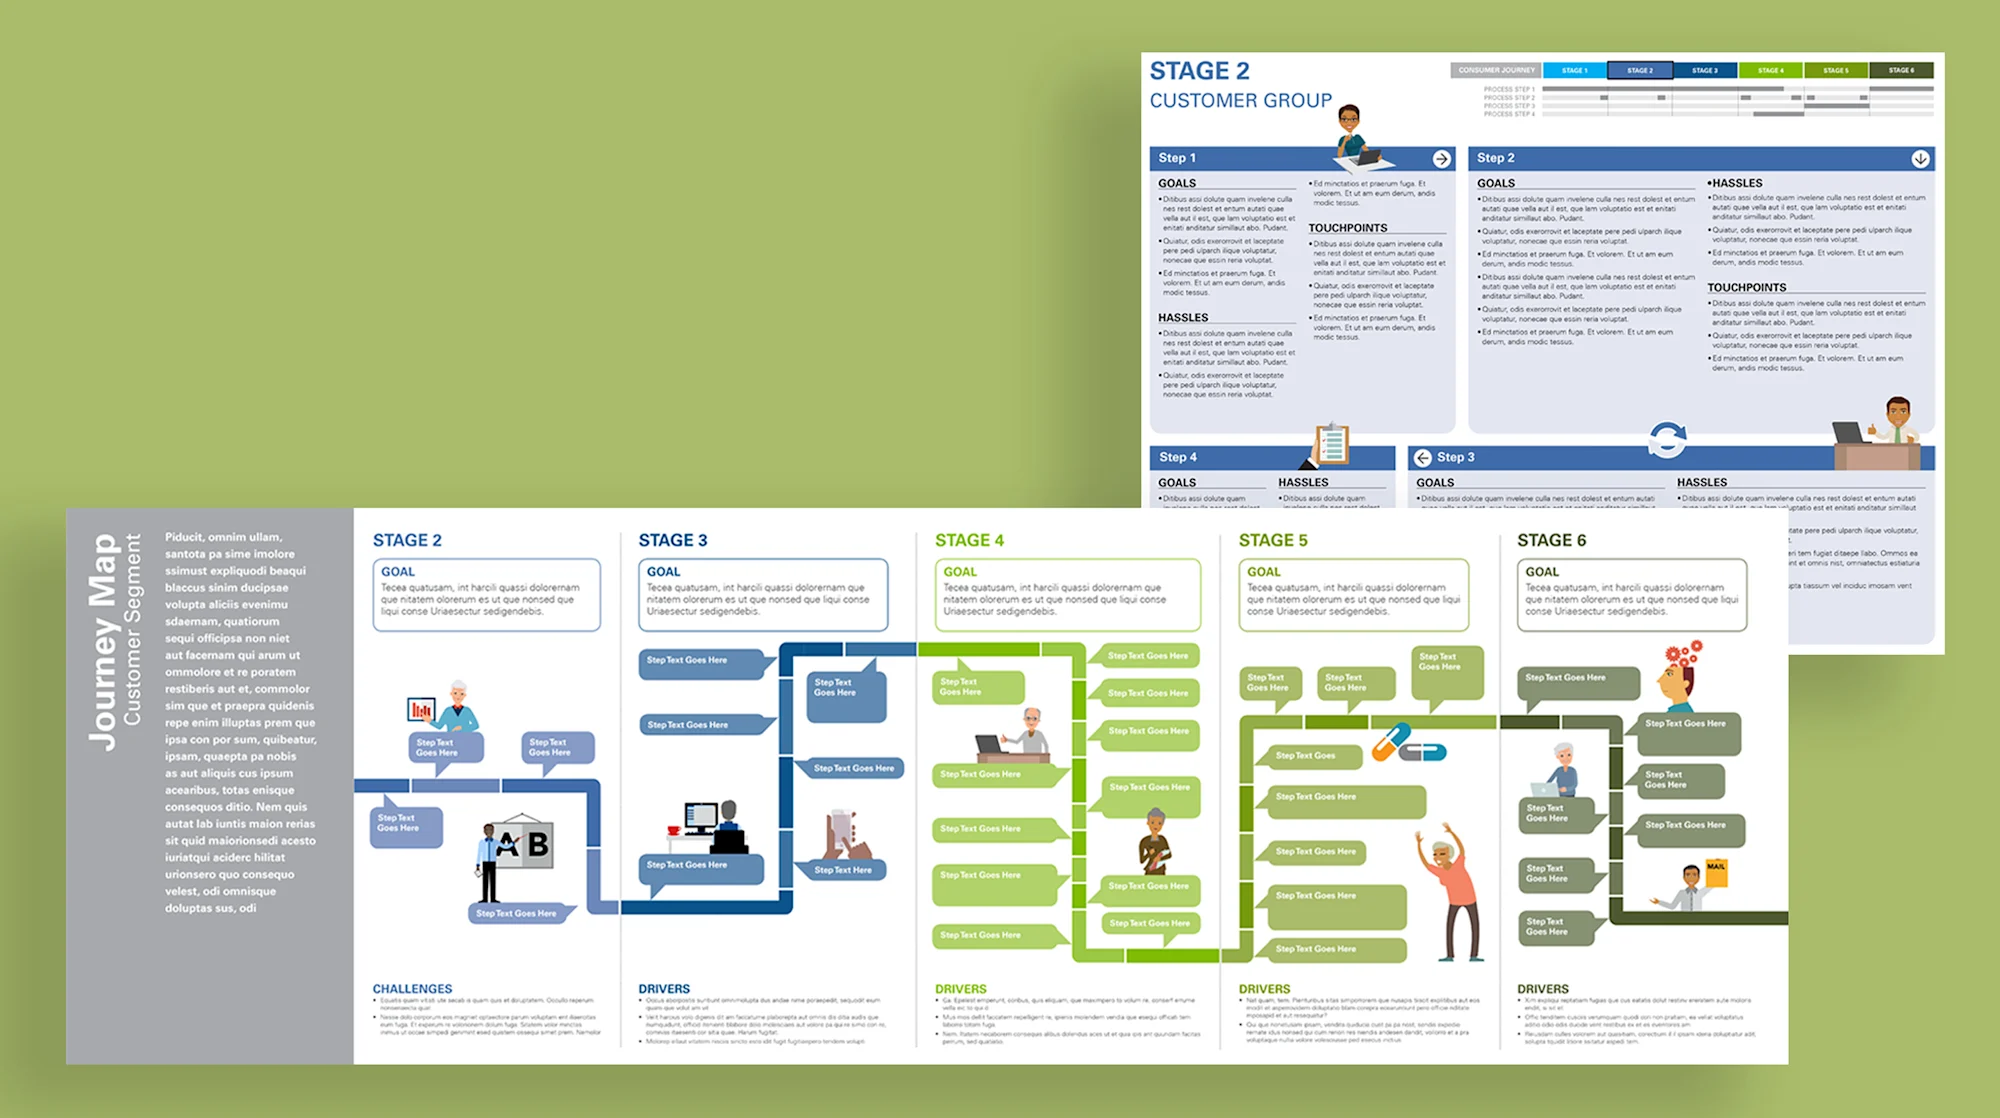
lcp helped design a series of customer journey maps for a national healthcare insurance provider, including end-to-end customer experience, and customer challenges as mapped to internal teams.